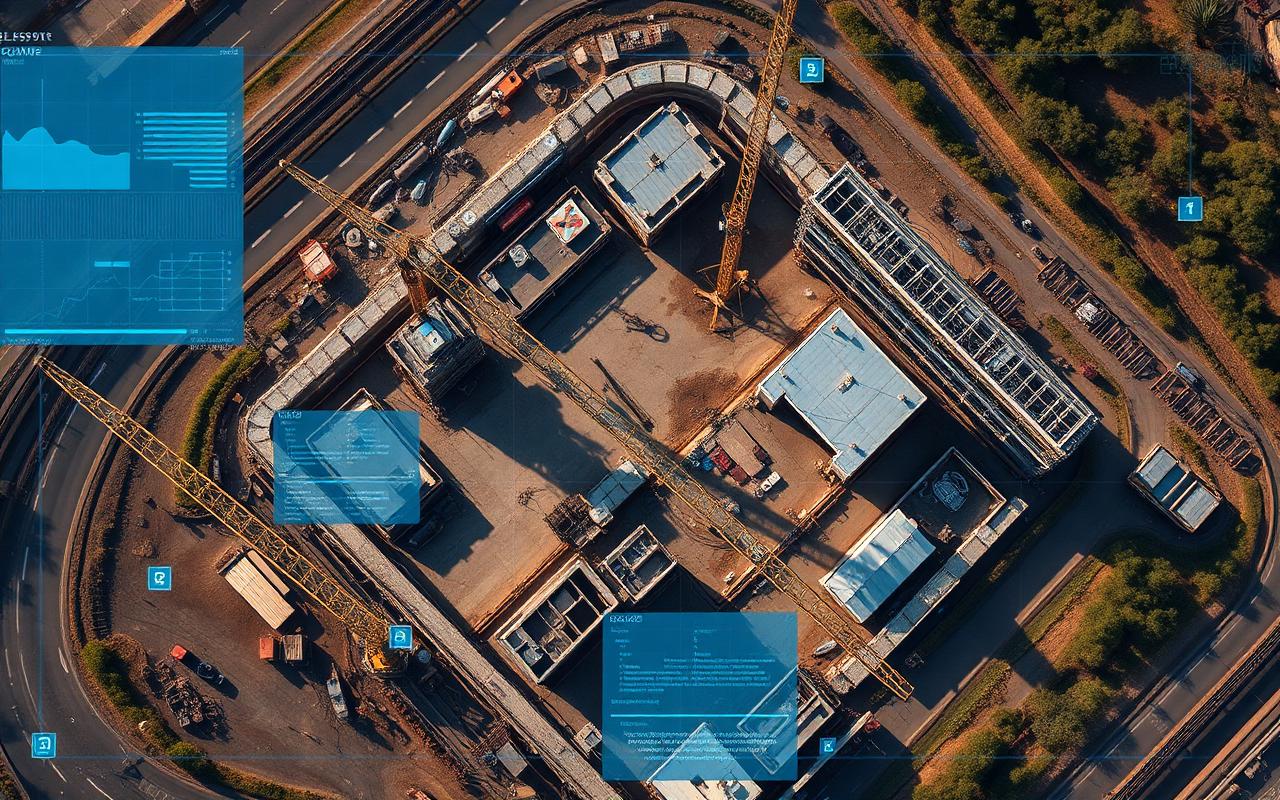
Each weekly report opens with a header showing the project name, capture dates, and the headline change percentage — the share of the site footprint where measurable construction activity occurred.
Below the header you'll find side-by-side captures with annotated overlays. Green polygons indicate new construction; yellow indicates equipment movement; red flags anomalies that may warrant a closer look.
The milestone tags translate visual signatures into construction phases — earthwork, foundation, framing, dry-in, finishes — so you can match progress to your draw schedule without interpretation.
Finally, the anomaly section surfaces stalled activity, unexpected equipment removal, or unusual material staging. Treat these as conversation starters with your borrower, not verdicts.
Pricing
Start monitoring your sites this week
Month-to-month plans, cancel anytime. Every plan includes weekly satellite captures, AI change detection, and automated PDF reports.
Starter
For lenders and developers monitoring a single active project.
- 1 active site
- Weekly satellite captures
- Automated PDF reports
- Email support
Growth
For portfolios of 2–25 active loans or projects.
- Up to 25 sites
- Daily captures + alerts
- Branded reports + API
- Portfolio dashboard
Enterprise
For institutional lenders, funds, and insurers at scale.
- Unlimited sites
- SSO / SAML
- Dedicated CSM
- Custom SLAs
A traditional in-person draw inspection costs $1,200–$3,500. Satellite monitoring delivers weekly verification for a fraction of that — see the full pricing page for volume discounts.